(For the remainder of this post I'll infer "stress testing" and "load testing" as the same thing, though strictly speaking one tests for your application falling over, and the other how fast it responds under load)
So how to go about stress testing a web application?
There are numerous tools available to stress test web applications, paid and free. This post will look at the setup and use of Apache's JMeter, my tool of choice, mainly because it is free! ... to undertake a very simple stress test. Apache JMeter is available here, version 2.3.3 at time of writing.
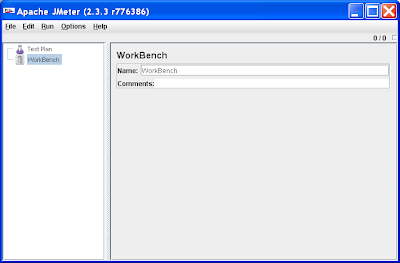
On starting JMeter (<jmeter-home>/bin/jmeter.bat on Windows) you'll see the following:
Creating a Thread Group
From here what we want to do is set up a Thread Group that simulates a number of users (concurrent sessions), done by right clicking the Test Plan node -> Thread Group option. This results in:
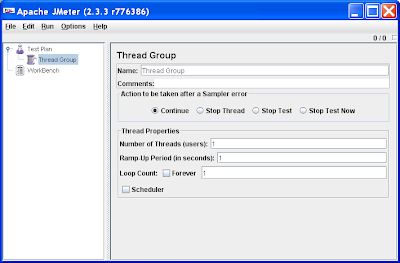
As you can see the Thread Group allows us to set a number of threads to simulate concurrent users/sessions, loop through tests and more.
Creating HTTP Requests
From here we can create a number of HTTP requests (Test Plan node right click -> Add -> Sampler -> HTTP Requests) to simulate each HTTP request operation (Get, Post etc), HTTP headers, payloads and more. However in a standard user session between server and browser there can be a huge array of these requests and configuring these HTTP requests within JMeter would be a major pain.
Configuring the HTTP Proxy Server
However there's an easier way. Apache JMeter can work as a proxy between your browser and server and record a user's HTTP session, namely the individual HTTP requests, that can be re-played in a JMeter Thread Group later.
To set this up instead right click the Workbench node, Add -> Non-Test Elements -> HTTP Proxy Server:

To configure the HTTP Proxy Server do the following:
* Port – set to a number that wont clash with an existing HTTP server on your PC (say 8085)
* Target Controller – set to "Test Plan > Thread Group". When the proxy server records the HTTP session between your browser and server, this setting implies the HTTP requests will be recorded against the Thread Group you created earlier, so we can reuse them later
* URL Patterns to include – a regular expression based string that tells the proxy server which URLs to record, and those to ignore. To capture everything set it to .* (dot star). Be warned that during recording however, if you use your browser for anything else but accessing the server you wish to stress test, JMeter will also capture that traffic. This includes periodic refreshes by web applications such as Gmail or Google Docs that you don't even initiate; I'm pretty sure when replaying your stress test, Google would prefer you not to stress test their infrastructure for them; stick to your own for now ;-)
The end HTTP Proxy Server setting will look something like this:
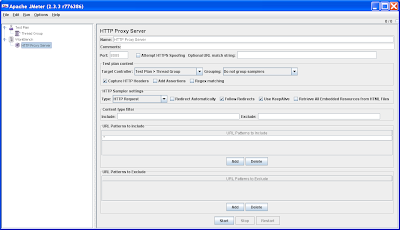
You'll note the HTTP Proxy Server has a Start button. We can't use this just yet.
Configuring your Browser
In order for the JMeter HTTP Proxy Server to capture the traffic between your server and browser, you need to make some changes to your browser's configuration. I'm assuming you're using Firefox 3 in the following example, but same approximate steps are needed for Internet Explorer.
Under Firefox open the Tools -> Options menu, then Advanced icon, Network tab, Settings button which will open the Connection Settings dialog.
In the Connection Settings dialog set the following:
* Select the Manual proxy configuration radio button
* HTTP Proxy – localhost
* Port – 8085 as per the JMeter HTTP Proxy Server option we set earlier
* No Proxy for – ensure that localhost and 127.0.0.1 aren't in the exclusion list
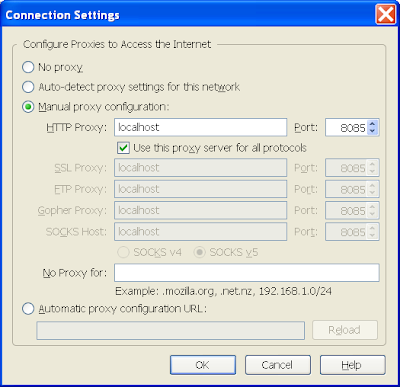
The above setup makes an assumption that the server you want to access is accessibly without a further external proxy required.
Recording your HTTP session
Once the browser's proxy is setup, to record a session between the browser and server do the following:
1) In Apache JMeter hit the Start button on the HTTP Proxy Server page
2) In your browser enter the URL of the first page in the application you want to stress test
Thereafter as you navigate your web application, enter data and so on, JMeter will faithfully record each HTTP request between the browser in server against your Thread Group. This may not be immediately obvious, but expand the Thread Group and you'll see each HTTP request made from the browser to server:
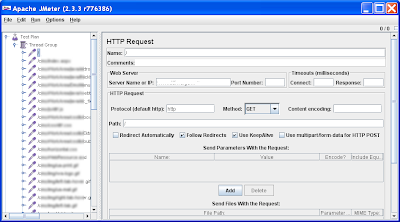
As can be seen, even visiting 1 web page can generate a huge amount of traffic. Ensure to stop recording the HTTP session by selecting the Stop button in the JMeter HTTP Proxy Server page.
Configuring the Thread Group for replay
Once you've recorded the session in the Thread Group there are a couple of extra things we need to achieve.
For web application's that use Cookies and session IDs (JDeveloper's ADF uses a JSessionID for tracking sessions) to track each unique user session, we cannot replay the exact HTTP request sequence with the server through JMeter, as the session ID is pegged to the recorded session, not the upcoming stress test sessions.
To solve this in JMeter right click the Thread Group -> Add -> Config Element -> HTTP Cookie Manager. This will be added as the last element to the Thread Group. I usually move it to the top of the tree:
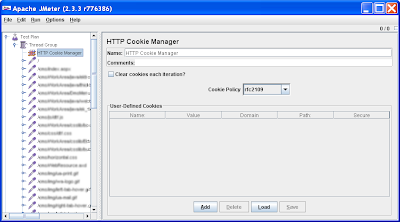
Next we need to configure the Thread Group to show us the results of the stress test. There are a number of different ways to do this, from graphing the responses, to showing the raw HTTP responses. In this post we'll take the later option.
Right click the Thread Group -> Add -> Listener -> View Results in Tree, which will add a View Results in Tree node to the end of the Thread Group:
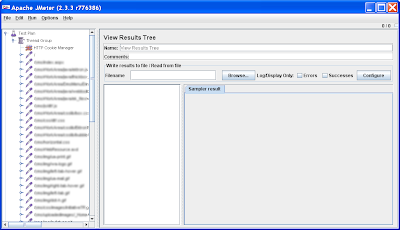
Finally save the Thread Group by selecting it in the node tree, then File -> Save.
Running the Thread Group
To commence your first stress test run, it's best to leave the number of spawned sessions to 1, just to see the overall test will work in it's most basic form. The default Thread Group number of threads is set to 1, so there is no need to make a change to do this.
To run the test, simply select the Run menu -> Start. On running the Thread Group, you'll see the top right of JMeter has a little box that tells if it's still running, and the number of tests to go vs total number of tests:
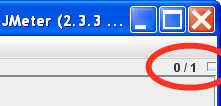
Once the tests are complete, this indicator will grey out.
We can now visit the View Results Tree:
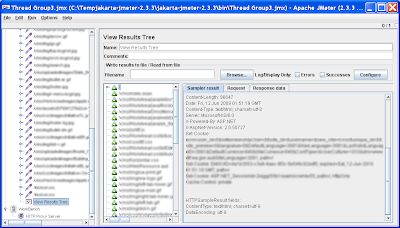
This shows the HTTP requests that were sent out and on selecting an individual request, you see the raw HTTP request and the actual response. You'll note the small green triangles showing a successful HTTP 200 result. If different HTTP errors occur the triangles show different colours. Also remember that sometimes application errors don't perculate up to the HTTP layer in your web application, so you should check your application's logs too (in the case of a JEE application, this will be your container's internal logs).
Running a Stress Test
The obvious step from here is to change the Thread Group number of threads to a higher number.
From here take time out to explore the other features in JMeter. It includes a wide range of features that in particular make it useful for regression testing.
Caveats
Firstly remember when doing this you're not only stress testing your application, your stress testing a server, potentially stress testing databases, stress testing your networks and so on. Therefore you can have an affect on anybody sharing those resources. "Hard core" stress tests should be on separate infrastructure, after hours, aiming for as little impact on those around you!
Also keep in mind, besides seeing your application fall over at 2 users, 10 users, 100 users, which is an important test, try to be realistic about your stress tests. Stress testing you're brand-new-application to a 1 million concurrent users is probably not being realistic. How many concurrent user requests do you really expect and what response times do you need? Normally when I ask managers this question they'll answer with, "oh we have 1000 concurrent users, the application must support that many at any one time". However what they really mean is the application has 1000 users, potentially all logged into the application (ie. sessions) at the same time, but not necessarily hitting the server with HTTP requests at any onetime.
(Later note: for readers interested in specifically testing JDeveloper's ADF, see this more recent post).

14 comments:
Cool Chris,
This was my problem with jmeter. And what are the result of a 11g and 10.1.3 ADF web application
For web application's that use Cookies and session IDs (JDeveloper's ADF uses a JSessionID for tracking sessions) to track each unique user session, we cannot replay the exact HTTP request sequence with the server through JMeter, as the session ID is pegged to the recorded session, not the upcoming stress test sessions.
To solve this in JMeter right click the Thread Group -> Add -> Config Element -> HTTP Cookie Manager.
cheers
Sort of related to sessions, is there a way to amend the submitted values. I'm thinking a way to simulate 100 users looking at 100 different orders rather than 100 users all looking at the same order (which has been grabbed from the DB by the first session and served from the application's cache for the other 99).
Hi Gary
Currently jetlagged on the flight home, so this might not be entirely reliable.... but I believe so, there's the concept of variables, have a look at the JMeter manual. I think you can retrieve their values from the http request/response and populate the variable, then use the variable elsewhere. Otherwise there's a random number generator too.
Cheers,
CM.
Thanks.
Got some time on the bench, so I'll try to look into it.
Chris,
Also saw your write-up in Apache (http://apache.sys-con.com/node/1011417). Any chance you can write it up in a paper we can put on OTN?
I have already passed this along to our internal QA team but I'm sure the wider OTN community would find this very valuable.
Cheers,
David
Hi David
Sure, I'll see what I can arrange with Justin Kestelyn.
Cheers,
CM.
Hi Chris,
Thanks for the tutorial.
We use ADF in our application . I tried jmeter . Everything works fine.
But there is one problem.
Suppose I have a series of requests, done by a user, only 1st request works, remaining requests does not work. Give me the following error for each subsequent request
Oct 26, 2009 11:57:01 AM org.apache.myfaces.trinidadinternal.application.StateManagerImpl restoreView
SEVERE: Could not find saved view state for token 5ba0b4fb
This token (5ba0b4fb) is present in the value of javax.faces.ViewState parameter in the request.
Doubt: How do I get this parameter from the first request , then i use the same for subsequent requests ?
( I have a cookie manager in my thread group )
Thanks,
Harsha
Hi Harsha
I believe there a number of reasons this error can occur. The one I've experience with:
http://one-size-doesnt-fit-all.blogspot.com/2009/08/jdevadf-importance-of-getting-pstxn-and.html
Hope this helps.
Regards,
CM.
Hi Chris.
It may be "cheating" somewhat compared to the purist approach of proxy-ing via JMeter, but the guys at Bad Boy Software (no I don't work for them) http://www.badboy.com.au have a great front end tool for JMeter in their Badboy product.
Makes recording the test steps a breeze and with an easy export feature you can record and then run your tests in JMeter very quickly.
HI Chris, LoadStorm isn't perfect, but I really like their load testing tool. The price is unbeatable. Using their virtual user data sets for authentication is cool & easy. Wish they had more scripts control.
thanks, phil
Thanks Phillip. Horses for courses I suspect.
CM.
Hello Chris, nice work on the article! :-)
On pages with Authentication = public, jmeter works fine. However I am trying to include the apex authentication and session, in the test plan! (to avoid changing all pages to public)
I am using regular expression extractors to get ->
name="p_instance" value="(.+?)"
and ->
name="p_page_submission_id" value="(.+?)"
and I am also posting username/pass values.
However, I can not go through the login page of appex. (e.g. page 101, on Sample Application)
Do you have a workaround? Is it working on your tests ?
Do you know I have to fill in the p_md5_checksum ? I assume it is calculated in Javascript, hence I dont know how to emulate it in jmeter (?)
Any ideas ?
Maybe I should write a stored procedure that makes all pages of an app, public :-)
Thanks!
Hi Manolis
Unfortunately no, you're a bit beyond my dabblings with Apex I'm afraid. Sorry I can't be of more help and good luck :-)
CM.
Found where the session problem was!
It seams that with Application Express 3.2.1.00.12
the "HTTP Cookie Manager" of jmeter, works properly at "compatible" policy only!
If anyone had similar problems, that should help!
Post a Comment